

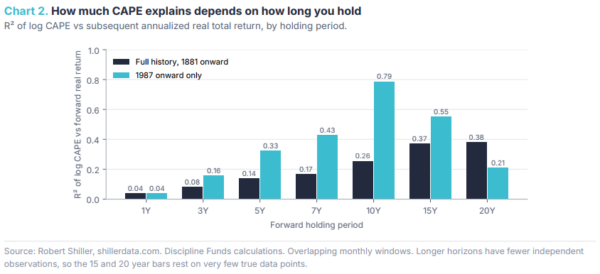
Every few months a PE ratio chart circulates implying that equities are so expensive that you need to get out of the market. These charts typically circle around 3 or 4 independent sample periods with the Nasdaq bubble doing most of the heavy lifting. The conclusion is, PE ratios are a good timing tool so be cautious about valuations that look similar to the Nasdaq bubble. In a new research piece we find that this is hugely misleading and that valuations are a consistently limited tool for timing the market. In fact, we find that buy and hold works better than valuation based timing approaches. But this doesn’t mean valuations are useless. Valuations are just being used incorrectly.
We find that valuations are a very useful sequence risk tool. That is, starting valuations tell you a lot about the range of outcomes you’re signing up for, but almost nothing about when those outcomes will show up. A high valuation is really just a high expectation. And when expectations are high there’s less room for the asset to disappoint before you feel it. Going back to 1881, buying stocks in the cheapest fifth of valuations never produced a negative real decade. Buying in the most expensive fifth did it 27% of the time. But over one year, valuations explain almost none of what stocks do.
So the right question isn’t “should I be in or out of equities when valuations are high?” It’s “how much of my near term spending should depend on an asset that’s priced this richly?” That’s a time horizon question, not a timing question. It’s exactly what Defined Duration® is built to answer. In this paper we walk through the data, why the popular charts oversell their precision, and how we think investors should actually use valuations when building a portfolio.