

Here’s a little weekend reading for you and three things I think I’ve been thinking about this week. If you prefer video I did an interview with JD Durkin at the NYSE this week. It starts at minute 17 and we discussed the macroeconomic view as well as where the markets are at.
1) That Buyback Doesn’t Mean What you Think It Means.
The US Treasury announced a $2 billion buyback program this week. Treasury Secretary Bessent said:
“Part of it is signaling here, and to show that we believe that the yields don’t reflect the underlying fundamentals.”
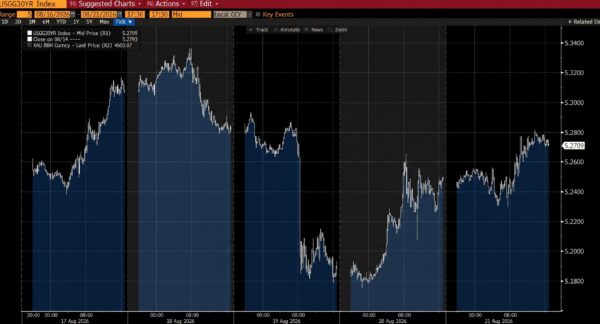
Okay, so the market is wrong according to Bessent. Interesting. We’ll return to that in a second, but let’s talk about what’s really happening here. In short, long dated yields had started to bump to 20 year highs at 5.3%. Mind you, this isn’t really that high in the grand scheme of things, but for an administration that wanted lower interest rates this year this is obviously moving in the wrong direction. And this program is very specifically designed to help turn yields around, or at least cap them. And they’re doing that by defending the long end of the curve.
Most market participants took this to mean that the US government was firing up some version of QE or big time stimulus again. Many others were claiming the government had to do this to avoid some sort of impending calamity. I think that’s overstating things. I’ll explain why.
The Treasury pays for the buybacks out of the Treasury General Account at the Fed and then replenishes that cash by modestly increasing its regular bill auctions, so the net effect is a maturity swap where long bonds come out of the market and T-bills go in, with no lasting drawdown of Treasury’s cash balance. But the Treasury isn’t the Fed – they cannot just create money out of thin air. They actually have to source money from the TGA (and ultimately new issuance). But there’s a lot of money currently in the TGA (almost a trillion dollars). And so what they’re doing is kind of like a backdoor Operation Twist with the goal of buying back debt in an effort to shorten average maturities and ease financial conditions by trying to cap interest rates. This isn’t “money printing” in any meaningful sense of the word. They’re swapping outstanding bonds by giving banks cash. That’s stimulative in the sense that it frees up regulatory capital, signals a bazooka threat and has marginal interest rate effects. And it’s strangely net stimulative in the broader scheme of things because the US government’s borrowing costs should rise incrementally by shifting more of the interest burden to shorter dated bills that now pay higher rates. But we’re talking about extremely small figures here. The US bond market is $60+ trillion. A few billion in bond buybacks here and there isn’t a bazooka, it’s a water pistol.
When QE was first initiated in 2008 I often said that they were doing this all wrong and that it wouldn’t be inflationary or even all that stimulative. The Fed was setting a quantity instead of a price. If the Fed wants to be the 800 pound gorilla in the room they need to set a price and then challenge anyone to fight their bottomless bucket of reserves at that price. But QE didn’t do this. They basically said, “we’re gonna throw a trillion dollars at long bonds”. That still lets the market set the price even though there’s now a great big buyer. If you’re going to be the gorilla you need to draw a line in the sand and defend it, not just be the gorilla and retreat on price whenever someone comes at you. But that’s what they did and so QE didn’t end up causing a lot of inflation because it wasn’t really the bazooka that a lot of people claimed it was. This buyback program is not only much smaller, but it’s being done by the entity that doesn’t really have a bazooka in the first place. The Treasury is specifically constrained by the balance in the TGA so their bazooka is still big, but it’s limited in its ability to defend because it runs out of rockets.
The chart above is really interesting because the bond market reacted in a very bullish way at first and then completely reversed the move over the last two days. I think that’s the right response to this. I will say, bluntly, that I think Bessent is wrong about the market fundamentals. I think the market sees an inflation environment that continues to be a modest problem. Yes, inflation has come way down from Covid, but it’s still stuck at 3-4%. That’s right where our Leading Inflation Index has been for a while now and it’s largely because the US government is intentionally disrupting oil markets while running huge deficits. The market simply sees what the government is doing and is pricing the risk accordingly. And I don’t think this buyback program is going to fix either one of those problems because it doesn’t solve the structural cause of the inflation that is leading interest rates higher.
2) Time to Panic About US Government Bonds, Right?
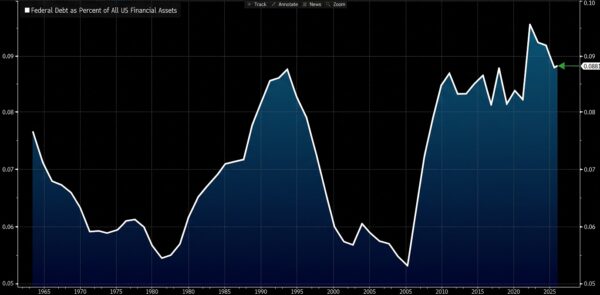
There were a lot of bad and excessively scary narratives about the US bond market this week in the wake of this program. The general tone was “the US government has to do this because the bond market is on the verge of collapse”. My impression is that many people look at big round numbers and just say “oh, this seems like it has to implode at some point because number big”. For instance, the US government’s debt passed $40 trillion this week. That is a humongous number. But so is the total value of US financial assets. Did you know that total US financial assets are almost $450 trillion? If you include non-financial assets you’re getting close to $600 trillion. So yes, the US government is huge, but it’s just huge inside of another yuger thing (misspelling intended!).
This chart shows the US government’s public debt as a percent of total US financial assets going back to 1960. We’re at the upper end of the range here, but the figure is still just 9% and was only 5.5% in 2005. This isn’t all that far out of the range we’ve been in for most of the last 15 years. So, if you were worried about a debt crisis in 2010 and you’re still worried about that debt crisis then you’ll probably have to keep waiting for that crisis.
None of this is to say that the US government should be running $2 trillion deficits forever or that interest rates aren’t moving up logically. But in the grand scheme of things there’s nothing that’s unsustainable about any of this. The more interesting thought experiment here is, if the government and Treasury really want to lower interest rates then the thing that needs to happen is we need to get inflation down. And if you want to get inflation down then we should get the deficit down. And to get the deficit down you shouldn’t be refinancing bonds at higher rates or running $2 trillion deficits.
I joked on Twitter that this bond buyback program while running a $2T deficit is like someone who is on Ozempic and intentionally eats 4,000 calories a day. These two things don’t work together to achieve the goal you’re trying to achieve.
3) All That said, Long Bonds Still Stink.
One of the cornerstones of the Defined Duration asset-liability matching framework is that you really shouldn’t use long bonds (or even aggregate or intermediate bonds) for longer duration asset matching because equities can be used as a standalone asset or embedded into multi-asset instruments to create superior options. It depends on the environment obviously, but I like to use the escape velocity concept to communicate the point of the curve that is currently optimal for matching. At current interest rates and durations that point is about 4.85 years. That is, once you get close to or beyond that point the risk/reward for bonds just doesn’t look that appealing. So for a matching strategy you shouldn’t match to anything beyond about 4-5 years. At that level blending equities with bonds will create synthetic instruments that capture an equity risk premia without having to rely on the “certainty” of bonds.
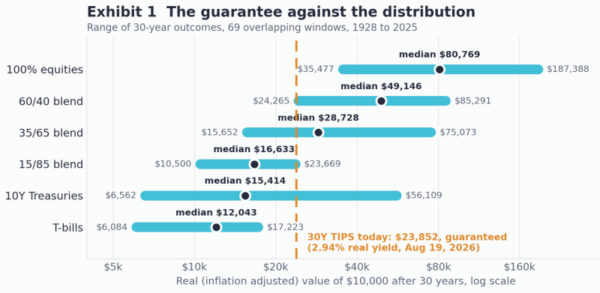
Speaking of “certainty”, next week I will be publishing a new research piece titled “The Price of Certainty”. One of the most common questions I get these days is about TIPS yields at almost 3%. If you can buy a 30 year TIPS at 2.94% then why shouldn’t an investor who is matching assets to liabilities just allocate most of their portfolio to TIPS? You get the guarantee of the TIPS return and a 3% real return guarantee. That’s pretty compelling. The problem is, that guarantee caps your upside and costs you an enormous amount of money in the long-run. A 2.94% real yield compounded for 30 years turns $10,000 of purchasing power into $23,852. That is the whole outcome. There is no upside case and no downside case. Now set that against what equities have done. Across the 69 overlapping 30 year windows in US data from 1928 through 2025, the worst real annualized return equities produced was 4.31%, in the window beginning in 1965. That window contained the entire Great Inflation and the 1973 to 1974 collapse. It still turned $10,000 into $35,477, which is 49% more purchasing power than the TIPS locks in today. The median window returned 7.21% real, or $80,769. In other words, if you have a 30 year window you should be running into equities despite the less certain outcome because the opportunity cost of that certainty is very high.
Anyhow, I’ll be out with that new piece next week so keep an eye out. If you’re worried about sequence risk (which every investor actually is) then you’re going to like the conclusions in there because we’re showing investors how to do asset-liability matching in a manner that is not only easily accessible, but likely to generate better long-term results than traditional fixed income ALM strategies.
Well, that’s all I’ve got for you this week. I hope you have a great weekend and of course, stay disciplined out there.