Apologies for the radio silence. I’ve been slammed with interviews and things related to my new book, but life is slowing and I am starting to think about other stuff again. Here are some things I think I am thinking about.
1) Rick Rieder for Fed Chair!
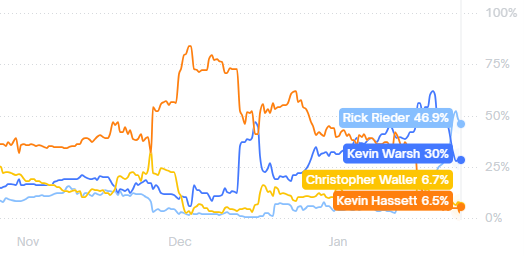
It was looking like Trump’s new Fed Chair nominee was a two man race between the two Kevins. I haven’t been especially jazzed about either of them, but then something funny happened in the last month – Rick Rieder exploded onto the scene and in the last week he’s become the sudden frontrunner.
Now, Rieder might not be a household name. But for those of us who work in the financial markets he most certainly is. After all, Rieder is the CIO of Blackrock Global Fixed Income and manages a whopping $2.4 trillion. I had the pleasure of meeting Rick 5 years ago at an event and he was really generous with his time and debating QE with me. He was incredibly open-minded which left an impression on me. It felt a little like talking into a mirror in some ways although his mirror is roughly 2.4 trillion times larger than mine.
I’ve always been super impressed by Rick’s market acumen, but especially his acumen around the plumbing of the financial system. The FOMC is typically filled with pure economists. Which is fine. But I love the idea of a market practitioner heading the Fed. It would bring a lot of diversification to a group of opinions that can often be dominated by theoretical ideas about how things work. I also think it might add a more real-time approach to policy as a market practitioner is more adept at interpreting near-term market conditions than someone who relies more heavily on lagging data. Practitioners have to be more forward thinking and I think this would add some really nice diversity of opinion to the FOMC.
Anyhow, I am excited about this one. I’d endorse him.
2) The real costs of housing.
I did something unusual in the new book where I very specifically depicted all the data in real terms. After all, we don’t eat nominal returns. If the S&P 500 returns 10% per year, your actual consumption doesn’t increase by 10% per year. It increases by what you have in your pocket after taxes, inflation and fees. That figure is much lower than 10%. And while we obsess about fees in the stock market it’s interesting that almost no one remembers the fees in their real assets like housing. And boy are they a whopper. Most people tend to remember the purchase price of a house and the sales price of a house. But they rarely adjust for taxes, fees and inflation along the way.

It’s an interesting thing to think about in the context of today’s consumer sentiment because I believe that housing is one of the main frustrations for people. Housing went up 50% during Covid and anyone with a low cost mortgage locked in one of the best inflation hedges of all time. But even with this extreme outcome the net costs of housing are massively understated.
For example, last weekend I had to install a new exhaust fan in our bathroom and homes in coastal Southern California are destined to get mold issues without one. Our previous one was undersized for the room it was in so I hopped up on the roof to cut a larger hole and make space for the larger roof vent it needed. It was all going smoothly until I went into our crawl space to get some old shingles to patch the roof and I heard a dripping sound. Turns out the water line into our fridge had somehow been dinged and was misting for at least a few days. It was an easy fix, but I had to cut out a huge slab of wet drywall and replace it. 8 hours later I finally got back to finishing the roof. Long story short, I spent my entire holiday weekend wishing I was a renter while I did drywall, roofing, plumbing and painting.
The moral of the story is – owning isn’t as glamorous as you might think. The little costs are constant and they add up in the long-run. Yeah, I’d typically still recommend buying over renting, but I really don’t think it’s the slam dunk discussion that some people tend to portray it as. Owning can be really awful at times. Especially if you’re a masochistic DIYer like me.
3) How not to lose money in the stock market.
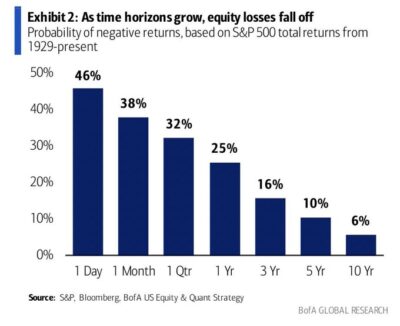
Here’s your chart of the month, from Brian Feroldi and Bank of America Global Research. He says the key to not losing money in the stock market is to just keep waiting….
The chart is something that I often portray and is an essential component in my Defined Duration methodology. It shows the probability of losing money in the stock market over different time horizons. I showed a similar table in the book displaying the probability of rolling monthly positive returns. Over a 10 year period you have an 88% chance of positive returns. Over a 20 year period you have a 99% chance of positive returns.
This is really interesting to think about in the context of an asset-liability matching methodology because traditional ALM strategies use bonds only because the outcomes are nearly definitive over specific time horizons. For example, if I buy a 10 year T-note today I know with almost near certainty that I will earn about 4.8% nominal returns over the entire 10 year period. If you were sending a kid to school in 10 years and you wanted to put away $150,000 and ensure a 100% chance of having $220,000 at that point you could buy this instrument. But if stocks are likely to be positive in 88% of outcomes over a 10 year period then wouldn’t you be better off taking some risk with this position? For example, what if you matched the instrument to a 40/60 stock/bond instrument? That has roughly a 10 year defined duration in my approach. And the returns on a 40/60 portfolio over the last 50 years have been 7% per year on average. In that case your $150,000 allocation grows to almost $300,000 on average. In the overwhelming majority of cases this will be a far superior liability matching instrument.
Of course, I can hear the kids in the front row groaning about sequence risk. But that’s the whole point of quantifying the defined duration! The max drawdown of a 40/60 portfolio is about -23%. So, even if you had the worst luck in the world and your portfolio falls -23% in year 9.99 then you still have a balance of about $230,000. Which means that even in an absolute worst case scenario you were better off matching the 10 year liability to a 40/60 instrument. You’re far better off in almost all cases creating a synthetic multi-asset 10 year instrument using a blend of stocks and bonds. Which makes sense. Long-term bonds are poor liability matching instruments when compared to equities because the cash flows that equities pay out become high probability cash flows over longer and longer time horizons. The trick is getting the time horizon long enough to where you don’t have significant sequence risk embedded in the portfolio.
I’d argue that’s the truly unique aspect of the Defined Duration approach. It quantifies equity durations in a way that allows us to build multi-asset instruments that can be embedded into portfolios to build a better overall asset ladder that goes beyond bond ladders.
Well, that’s all I’ve got for now. There’s a lot going on and things are about as crazy as I can remember them ever being in this country. So I don’t expect this to be a quiet year and you can expect me to be louder than I’ve been so far. I hope your 2026 is off to a great start.